Ying Zhao BI & Data Analyst Sint-Niklaas / Antwerp Annual review, 2026

Ying Zhao

I spent eight years responsible for the number. Now I build the analytics that move it.

Most analyst pages open with a dashboard. Mine opens with the decision. This page is set like the reports I deliver: every figure real, every claim reconciled, one recommendation at the end.

Latest delivery: a month-end reporting cycle at CN Consult, cut from 2 days to 2 hours.

Four numbers before a single adjective.

EUR 2M
Client book I held at 95% retention, eight years on the commercial side
+40%
EU revenue I helped grow, before I moved into analytics
2 days to 2 hours
Month-end reporting I rebuilt at CN Consult, in SQL and Power BI
200+ hrs/mo
Manual data-checking I gave back to a team at Spinewise

The problem you are actually hiring for

You are not hiring an analyst because you lack dashboards. You have dashboards. You are hiring one because decisions still get made on a gut feeling in a hallway, five metres from a report that answered the wrong question.

I spent eight years on the other side of that hallway, holding a EUR 2M client book at 95% retention and helping grow EU revenue 40%. When a report was late or wrong, the consequences did not land on the analyst. They landed on me.

Then I moved to Belgium and started over. I am a Cantonese speaker who learned Dutch and ended up inside a Belgian accountancy practice, where paper invoices lived in ExpertM and digital ones in Odoo, while the BTW deadline had no interest in the difference. I got tired of waiting for other people's reports to tell me what I already suspected. So I taught myself to build them, 1,000+ hours at BeCode deep, until the numbers I published were numbers I could defend.

Most analysts learn the model first and then go looking for a business to point it at. I ran the business first. That order is harder to fake, and it means you will not spend my first quarter explaining what a margin is.

If any of that sounds like your Monday, keep scrolling. Everything below is proof, not promises.

From my desk in Sint-Niklaas,

Two systems disagreed about the same money. Settling it took two days a month, until it took two hours.

At CN Consult, an Antwerp accountancy practice, paper invoices lived in ExpertM and digital invoices lived in Odoo. Same money, two versions of the truth. Keep scrolling; the match runs itself.

Two systems disagreed about the same money. Settling it took two days a month, until it took two hours.

At CN Consult, an Antwerp accountancy practice, paper invoices lived in ExpertM and digital invoices lived in Odoo. Same money, two versions of the truth. The BTW deadline does not care which one you believe. Below is the matching logic on recreated data: scroll, or press the button and watch it run.

Invoice match, month-endRecreated data

ExpertM, paper

Van Den Broeck BV1.240,00
Callebaut Kantoor NV386,50
Mertens & Zonen2.178,00
Drukkerij Peeters92,34
DE WITTE LOGISTICS4.560,00
Cash, no reference150,00
Verhuur Depot Noord780,00
Janssens Catering318,45

Odoo, digital

Van Den Broeck BV1.240,00
De Witte Logistics BV4.560,00
Callebaut Kantoor NV386,50
Mertens en Zonen BVBA2.178,00
Duplicate entry 884192,34
Drukkerij Peeters92,34
Janssens Catering, 12 Mar318,45
Verhuur Depot Noord780,00
Unmatched: 16

All suppliers and amounts are fabricated. The client's figures stay confidential; the logic is the real thing.

The work, in the order it should be judged

Paid work first. The three self-directed projects on public data come after, labelled as exactly what they are. Each card is written the way I write for clients: the number it moved, and the limit it will not stretch past.

Schedule A, paid work

200+ hrs/moSpinewise, internship

A month of capacity, handed back

Python and SQL data-quality checks caught the errors a team was finding by hand, after the damage, one spreadsheet at a time. More than 200 hours a month came back, and a reworked ETL ran 40% faster, so the data was ready when the decision was.

Prepared with: Python, SQL, ETL

Dashboards confidential, figures verified

Schedule B, self-directed

~R$498Kmodelled opportunity

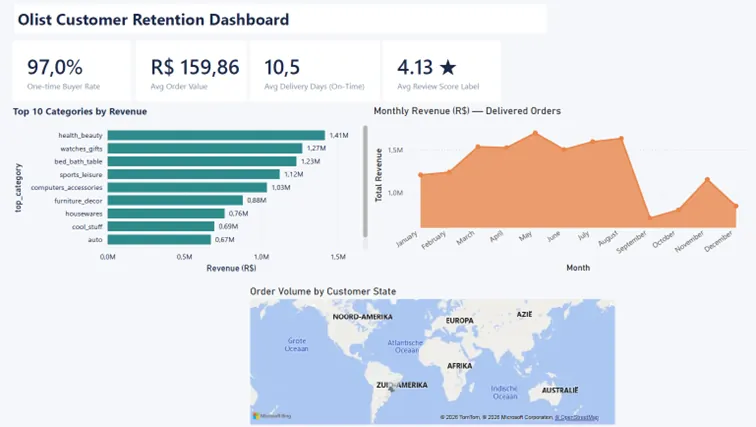
97% of buyers ordered only once, and what that is worth

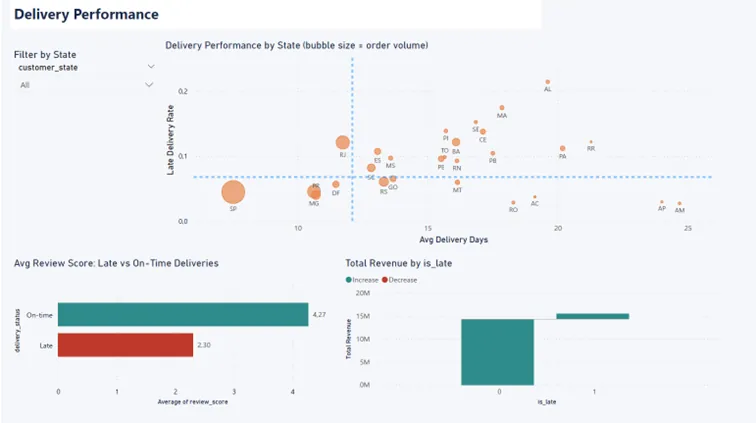
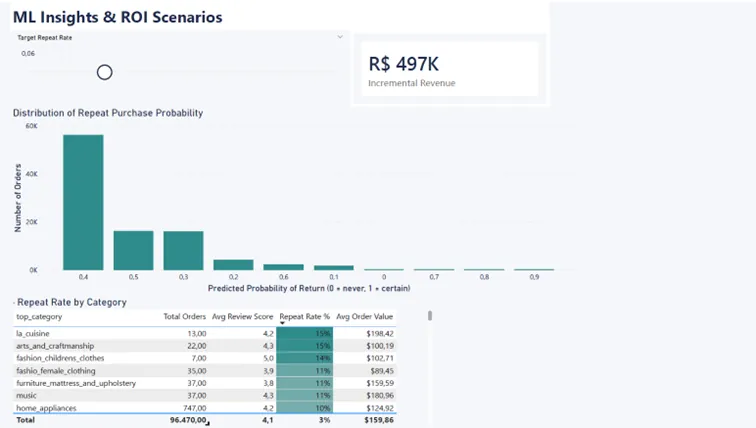
Only 3% of this marketplace's buyers ever came back. I found the two levers that move repeat purchase, late delivery and order value, then sized the prize: lifting repeat rate from 3% to 6% is worth about R$498K, a modelled estimate with assumptions shown.

Prepared with: Python, Random Forest, Power BI

Olist retention Power BI dashboard, executive overview
Exhibit B.1, executive overview, Power BI, built by me
Olist delivery and review analysis dashboard
Exhibit B.2, the delivery lever: late orders and review scores
Olist repeat purchase model dashboard
Exhibit B.3, the model behind the R$498K estimate

Schedule C, self-directed

$3.68MAUC 0.93 model

Putting a number on revenue at risk

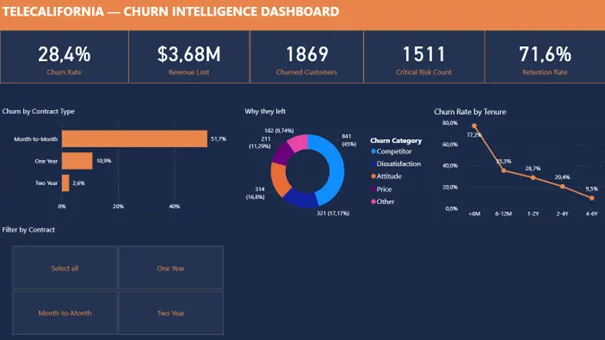
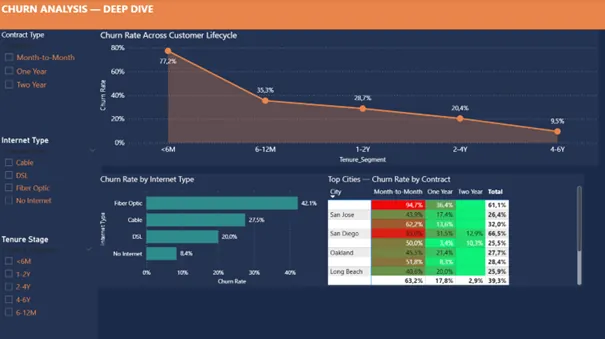
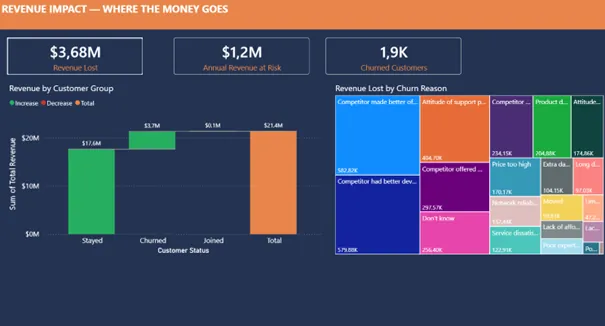
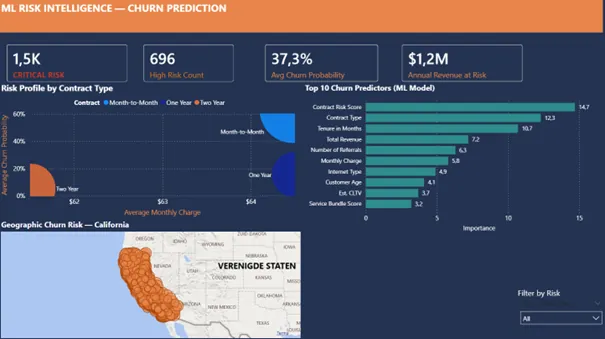
Churn had already cost $3.68M in customer revenue. The model I built ranks current customers by churn risk, so a retention team works the highest-risk accounts first instead of spraying offers across the whole base.

Prepared with: Python, Power BI, churn modelling

TeleCalifornia churn dashboard, executive overview
Exhibit C.1, executive overview, Power BI, built by me
TeleCalifornia churn drivers dashboard
Exhibit C.2, why customers leave: churn drivers
TeleCalifornia revenue at risk dashboard
Exhibit C.3, the $3.68M, traced revenue at risk
TeleCalifornia churn risk model dashboard
Exhibit C.4, the AUC 0.93 risk model, validated
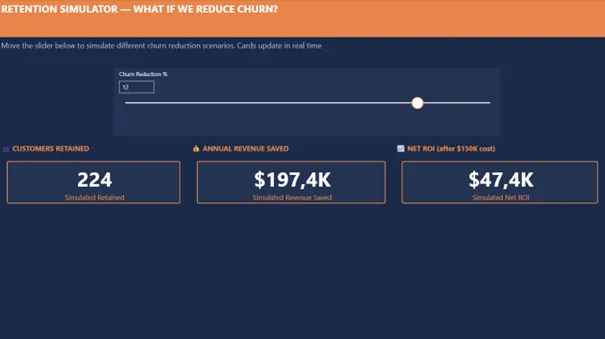
TeleCalifornia retention simulator dashboard
Exhibit C.5, the retention simulator a manager can drive

Schedule D, self-directed

R² 0.64screening tool

A 30-second screen on a Belgian asking price

Across 15,254 listings, a model that flags likely over and under-priced homes. It explains a little under two-thirds of price variation, so I use it as a fast first-pass filter, not as an appraisal. Owning the limit is the point.

Prepared with: Python, Random Forest, Power BI

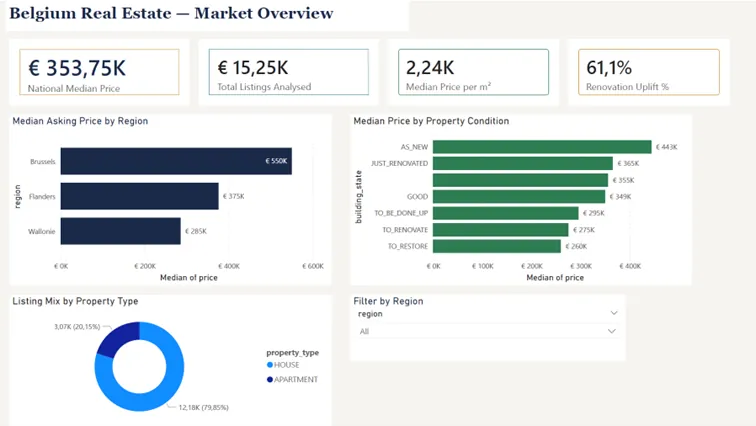
Belgium property market overview dashboard
Exhibit D.1, market overview, Power BI, built by me
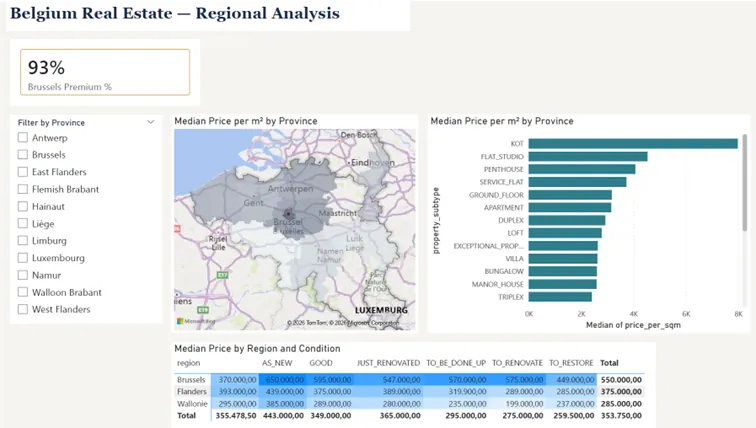
Belgium regional price analysis dashboard
Exhibit D.2, regional analysis: the Brussels premium
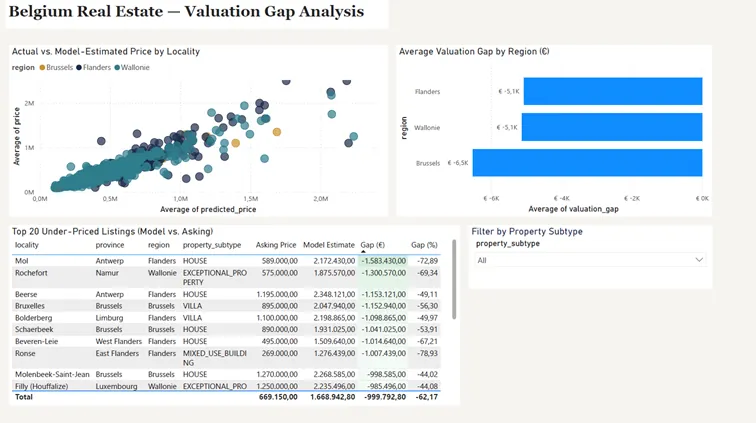
Belgium valuation gap dashboard
Exhibit D.3, the valuation gap: flagged over and under-priced homes
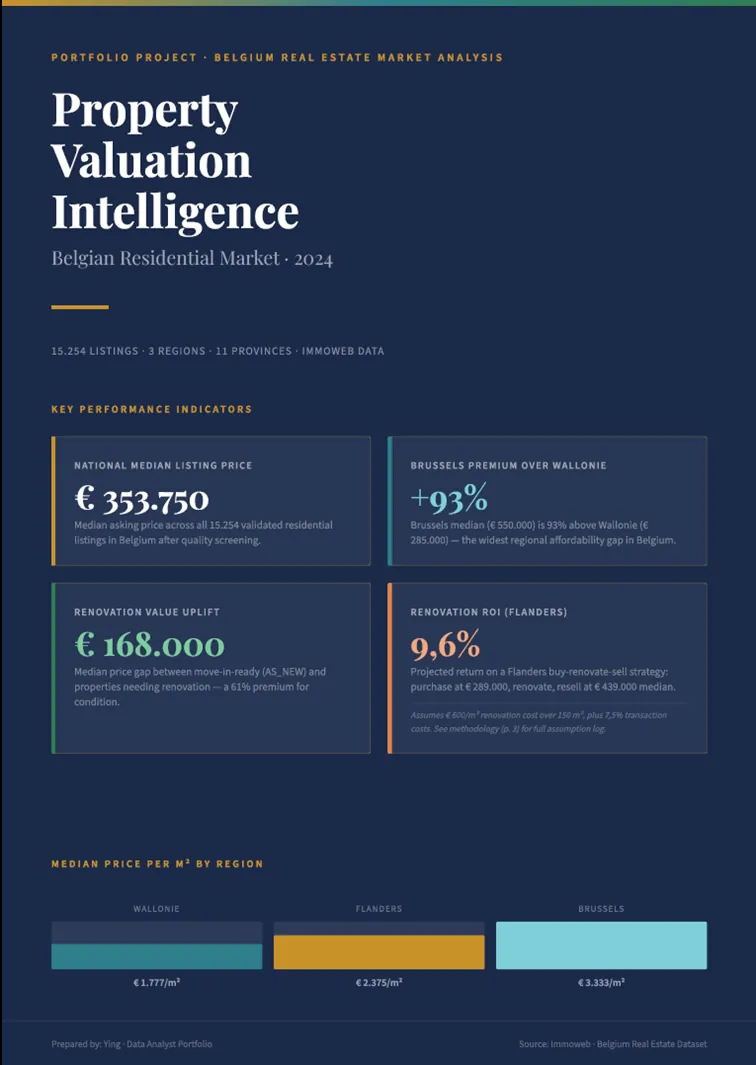
Belgium executive report page
Exhibit D.4, the one-page executive report
Next entry

The ledger stays open. The next project posts here.

I build the analysis and I present it myself. Nobody translates for me.

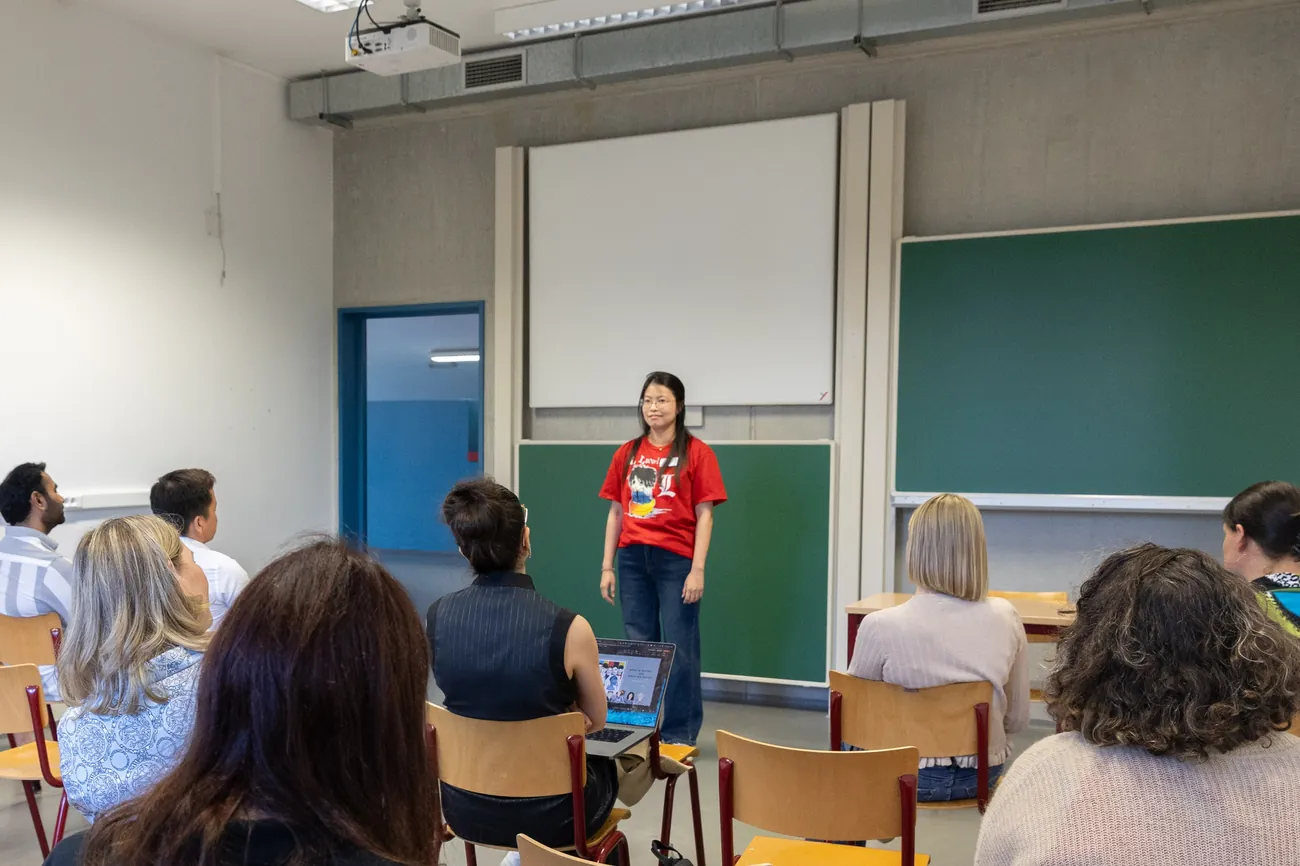
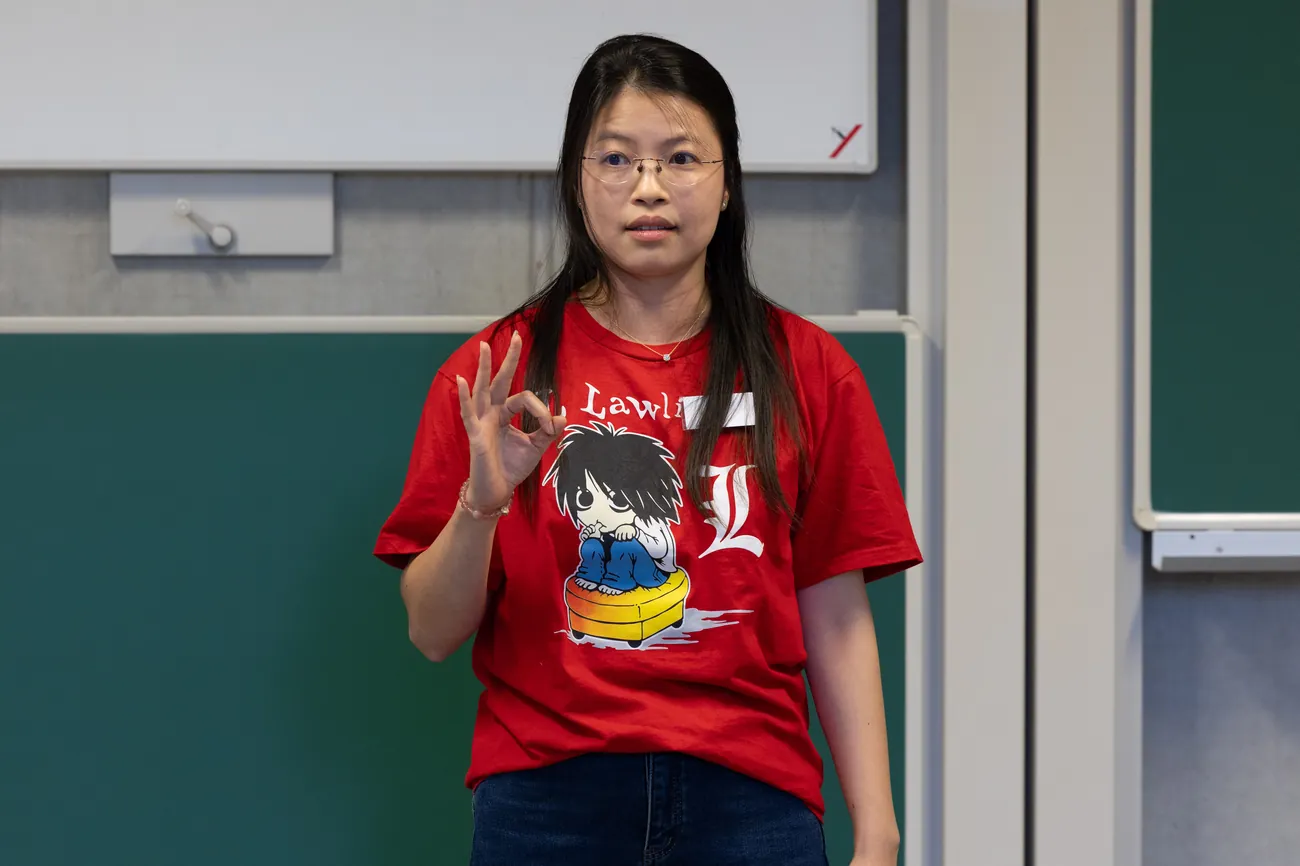
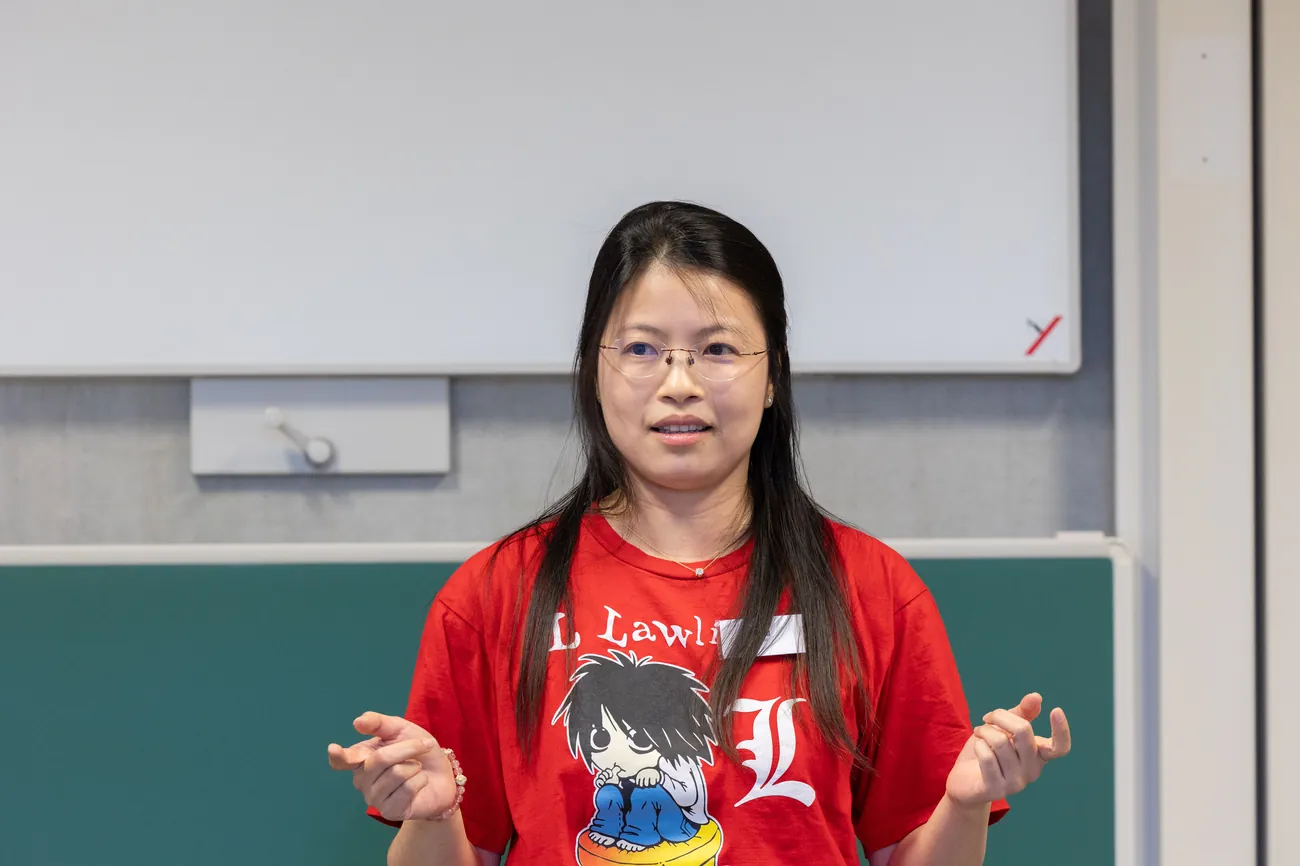
Interviews test whether the analysis is right. Nobody tests the moment the analyst has to stand up and make a room act on it. I trained that moment deliberately, on real stages in my second language. The photos below are from Clusity's Summer Gathering, the women-in-tech community's five-year celebration, where I was one of nine keynote speakers. My talk, "Both.", argues that the analyst who can read the room and read the data is the one you keep.

Ying delivering a keynote at Clusity's Summer Gathering, the audience seen from behind
Keynote at Clusity's Summer Gathering, delivering "Both."
Ying smiling while making a point during her talk
One beat before the punchline
Ying making a precise gesture while speaking
The point, made precisely
Ying speaking with both hands open, mid-explanation
Making the case, no slides between us

Scene one. I could barely hold my notes.

My first Toastmasters evening in Belgium: new country, second language, a room of strangers. I kept going back. My coach tells the rest of that story below, in his own words.

Scene two. The club put me in charge of its voice.

A year later I was elected VP of Public Relations for Toastmasters Belgium: running the club's messaging, and spending evenings helping other nervous people make one clear point to a room. That is most of what BI actually is once the SQL runs.

Scene three. The stage changed how I work.

Stand-up taught me the discipline a dashboard never will: cut what does not land and say the one thing that does, in words a tired person gets the first time. Bomb on stage and you know instantly. Ship a report nobody reads and you find out in three months. I prefer the honest feedback loop.

From my signature speech, "Both.": why the person presenting the data matters

Facial recognition error rate, lighter-skinned men0.8%
Error rate, darker-skinned women34.7%

Gender Shades study (Buolamwini and Gebru, MIT). The gap is who was in the training data, and who was in the room when it was signed off. Empathy and analysis are not rivals. You need both.

Reference

"When I met Ying, she trembled before she spoke. One year later, I watched her deliver a speech to several hundred people, steady enough to compete for an eloquence title. I have rarely seen anyone climb that fast."

Panda Lokhat Founder of Pandologie, rhetoric and public affairs coach, Brussels. He both coached my speaking and commissioned a data project.
Read Panda's full reference

"When I met Ying, she trembled before she spoke. She hesitated, second-guessed every sentence, apologized for taking up space. One year later, I watched her deliver a speech to several hundred people, steady enough to compete for an eloquence title. I have rarely seen anyone climb that fast.

What drives her is rare. She is not afraid to start from zero. She walks into a subject she knows nothing about and learns the whole thing, from the ground up, without flinching. She calls herself lazy. Do not believe a word of it. Behind that line is one of the most studious, demanding people I have worked with.

She built a data analytics project for me, and the result said everything about her. The insights were sharp and genuinely useful, and the work had a personality of its own. Even when she doubts herself, what she ships carries the mark of someone who refuses to deliver anything mediocre.

She has courage and patience that you do not notice at first. You feel them later, usually when everything around her is chaos and she is the one quietly putting it back in order, always bringing peace.

If you get the chance to work with Ying, take it."

Panda Lokhat, Founder of Pandologie, rhetoric and public affairs coach (Brussels).

The doubts you should have, run through the same matching engine

A reconciliation that hides its exceptions is lying. Same rule applies to a candidate. Here are the four objections a sensible hiring manager raises about me, matched against the record.

"A career switcher is a junior risk."Two years of hands-on analytics is two years.
reconciled
The eight years were not a detour, they were the domain training: a EUR 2M client book at 95% retention, accountable for the number every quarter. You are not hiring two years of experience. You are hiring eight years of knowing which question matters, plus the SQL to answer it.
"Portfolio projects are student projects."Everyone has a churn model on Kaggle data.
reconciled
Paid work leads this page: a month-end cycle cut from 2 days to 2 hours at CN Consult, 200+ hours a month handed back at Spinewise. The public-data projects sit second and are labelled as such. Two tiers, no inflation.
"Analysts cannot present to stakeholders."The report will be right and nobody will act on it.
reconciled
I was elected to run communications for Toastmasters Belgium and I have delivered a speech to several hundred people. The one-page report in Note 1 is what my reporting looks like. The presenting is not a promise, it is a practiced skill with witnesses.
"Her French is missing."Some Belgian teams need it.
exception, stated
True, and I will not pretend otherwise: English fluent, Dutch professional, Cantonese native, no French. If your stakeholders work in French, I am the wrong hire and we both save an interview. Every other exception on this page gets the same honesty.

Ying Zhao, BI & Data Analyst: the forwardable version

One copy button, the whole case. Every number on this list is verified.

Results

  • 2 days to 2 hours, month-end close at CN Consult.
  • 200+ hrs/month handed back to the team, Spinewise.
  • ETL 40% faster, same rebuild.
  • EUR 2M book at 95% retention, 8 years commercial.

Toolkit

  • SQL, Power BI, DAX, Power Query.
  • Python (pandas), Excel and VBA.
  • Odoo ERP and ExpertM, daily drivers at an accountancy practice.

Credentials and stage

  • 1,000+ hours, BeCode AI and ML bootcamp.
  • 2nd place, Accenture hackathon.
  • AWS Cloud Practitioner.
  • BA International Business, Coventry, UK.
  • Keynote speaker, Clusity Summer Gathering 2026, women in tech.
  • VP Public Relations, Toastmasters Belgium.

Practical

  • Sint-Niklaas based. Antwerp on-site, Belgium remote.
  • Eligible to work in Belgium.
  • English fluent, Dutch professional, Cantonese native, no French.
  • weiying.data@gmail.com · linkedin.com/in/weiying-zhao · github.com/Ying-Data
Ontwerp, wacht op review

Voor wie liever Nederlands leest

BI & Data Analyst in Sint-Niklaas, beschikbaar in Antwerpen en remote in heel België. Acht jaar commerciële ervaring, daarna de overstap naar analytics: SQL, Power BI, Python en Odoo. Bij een Antwerps accountantskantoor bracht ik de maandelijkse rapportering terug van twee dagen naar twee uur. Ik bouw de analyse en presenteer ze zelf, in mensentaal. Mail gerust in het Nederlands: weiying.data@gmail.com.

I instrument my own page. You should see what I do to a funnel.

These cards read from my own privacy-first analytics. If a number looks modest, that is because it is real. Anything that needs a fair sample before it means something stays private until it earns one.

live soon
Page viewscounting from go-live
0s
Your time on this pagethis visit, live
·
First section you openedthis visit

Built the way I would instrument a client's funnel: one honest metric per card, no vanity numbers, and no conversion rate shown until the sample is large enough to be fair.

You already know the question. Nobody in the room could answer it.

Why did margin slip, and why did nobody flag it until the quarter closed? Which customers are already halfway out the door? Send the vague version, exactly as it nags you. Vague is my raw material.

You get back how I would take it from question to decision, in plain language, before either of us has committed to anything. You find out how I think before you find out what I cost.

I am not the hire for a prettier chart factory. I am the hire for the manager who is tired of being the one every report escalates to, and who wants an analyst who reads the business, not just the schema.

Meanwhile the two-day close keeps eating its two days, and the customers you could have flagged keep leaving before anyone calls them.

Closing entry, this page

Month-end time, credited back2 days per cycle
Hours returned to the team200+ /mo, credited
Exceptions hidden from you0
Claims on this page without a source0
Noodles consumed during buildunaudited
Difference0,00

Books closed. Comedy gets my weekends; it does not get my numbers.